Pipeline
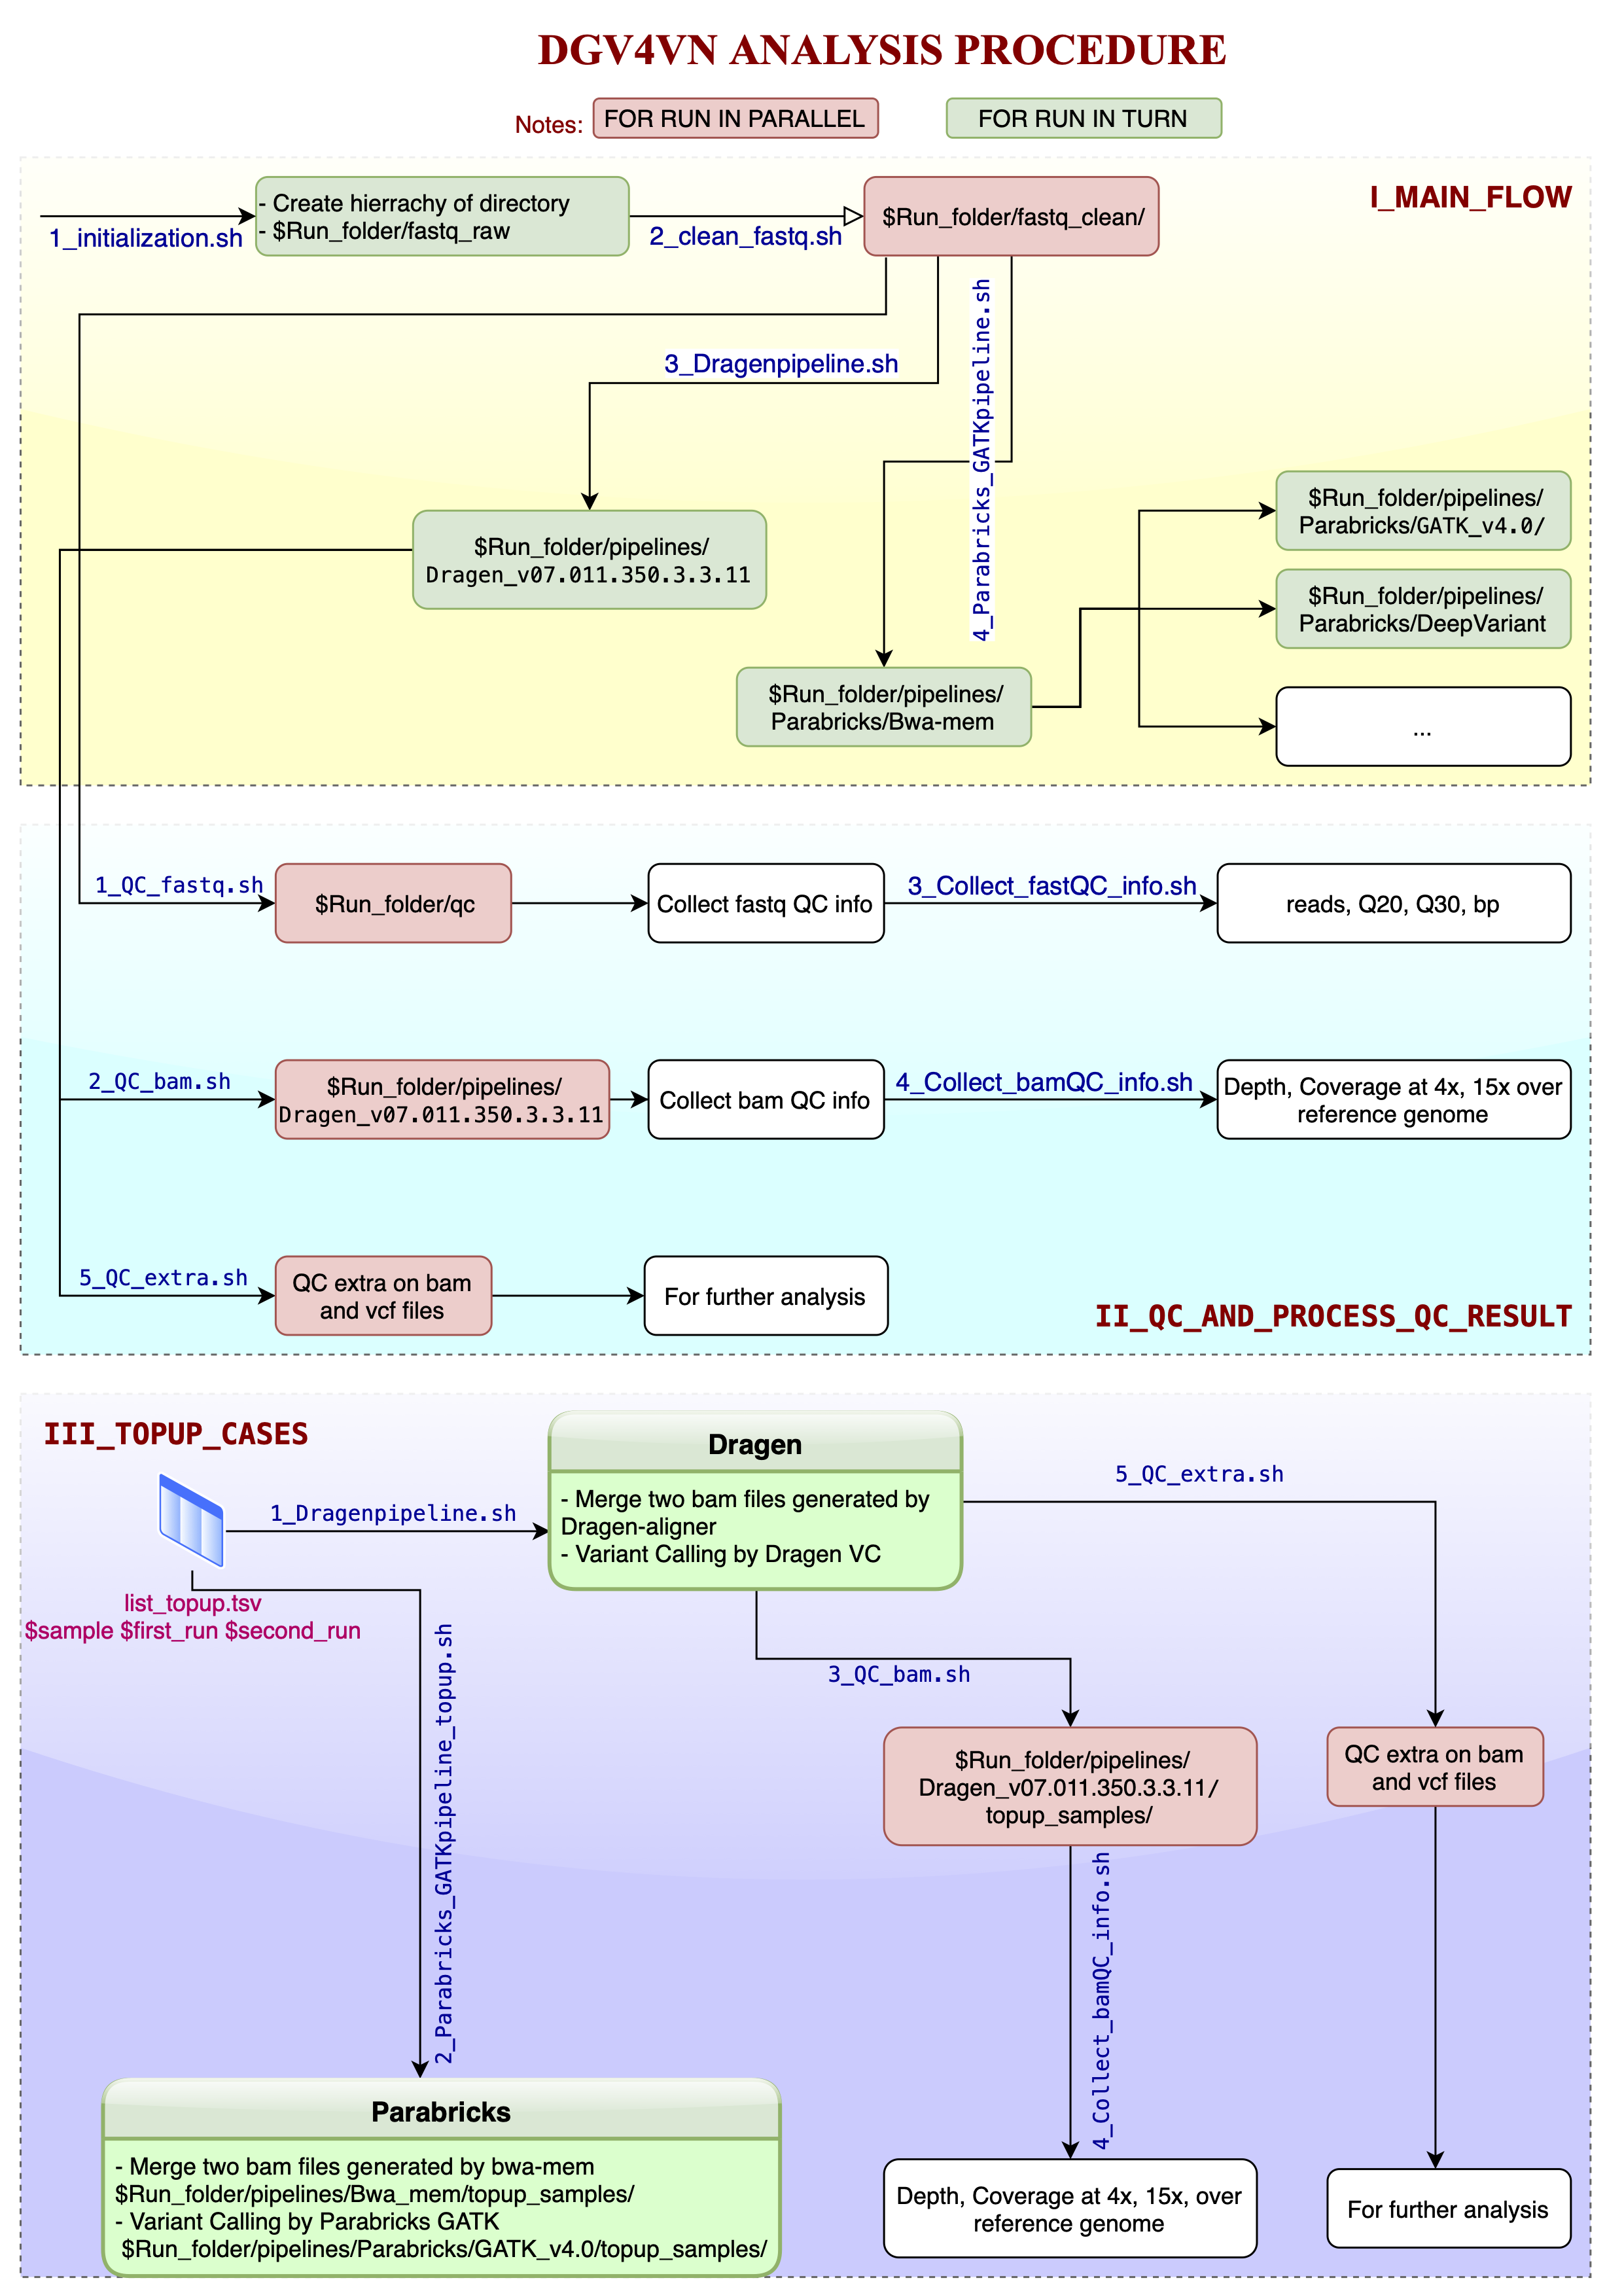
Germline SNP and short indel pipelines

QC procedure

The advance in NGS technologies has greatly improved our ability to detect genomic variants for biomedical research. One of the major challenges is quality control of the sequencing data. CBM team of VinBigData created the quality control procedures at three different stages of sequencing data:
QC level 0 on non-alignment files (raw and clean fastq files) to generate non-alignment based metrics
QC level 1 on alignment data (bam file) to generate alignment metrics
QC level 2 on variant calling data (vcf file) for the assessment after bioinformatic analysis
QC level 0
Raw fastq
Object: conducting quality control of raw data from Novaseq sequencing
Tools: FastQC v0.11.7
Input: fastq files of read 1 and read 2
Output: FastQC report include the information about:
Basic statistics: File name, number of reads, GC content
Per base sequence quality, Per tile sequence quality, Per sequence quality scores
Per base sequence content, Per sequence GC content, Per base N content
Sequence length distribution, sequence duplication levels, Overrepresented sequences, adapter content
Clean fastq
Object: conducting quality control of data after 5 cleaning processes:
Trimming adapter, trimming polyG and base 151 of reads
Filter reads whose low quality bases (<=5) is over 50%
Filter reads whose unknown bases (base N) ratio is over more than 10%
Tools: FastQC v0.11.7, fastp v0.20 report of cleaning process
Input: fastq files of read 1 and read 2 after cleaning process
Output: FastQC report include the information about:
Basic statistics: File name, number of reads, GC content
Per base sequence quality, Per tile sequence quality, Per sequence quality scores
Per base sequence content, Per sequence GC content, Per base N content
Sequence length distribution, sequence duplication levels, Overrepresented sequences, adapter content
Calculate percentage of clean data and quality improvement of data after cleaning
QC level 1
Object: providing additional insights into sample sequencing quality and identify bad samples that pass the QC level 0 checks. The QC level 1 implements quality check on data after mapping to reference genome (version hg38).
Tools: Picard v2.20 CollectRawWGSMetrics and Dragen mapping metrics
Input: bam file after mapping to a refence genome by dragen mapping or bwa mem.
Output: alignment metrics including the information about:
Depth = mean coverage
Coverage at 4x, 15x achieved the expectation of 95% and 90% respectively.
Coverage over reference genome (expected 98%)
Percentage of reference genome covered at the sequencing at that depth
QC level 2
Object: quality control of variant calling file to minimize the rate of false-positive Variant calling step.
Tools: Dragen variant calling report and GATK v4.1tools: VariantFiltration, VariantRecalibrator, ApplyVQSR, ValidateVariants, CollectVariantCallingMetrics.
Input: vcf file after performing variant calling by different tools: HaplotypeCaller by GATK v4.0, DeepVariant v0.7.1, CNNScoreVariant by GATK v4.1
Output: variant calling metrics including the information about:
The total of variants: the number of SNP, MNP, bi-allelic, multi-allelic SNV
The Ti/Tv ratio: the number of transition SNP divided by the number of transversion SNP (For human genome data, the Ti/Tv ratio is around 3.0 for exon SNP and 2.0 elsewhere – exclude mtDNA).
The other criteria of each site such as DP, GQ, MQ, VQSLOD.
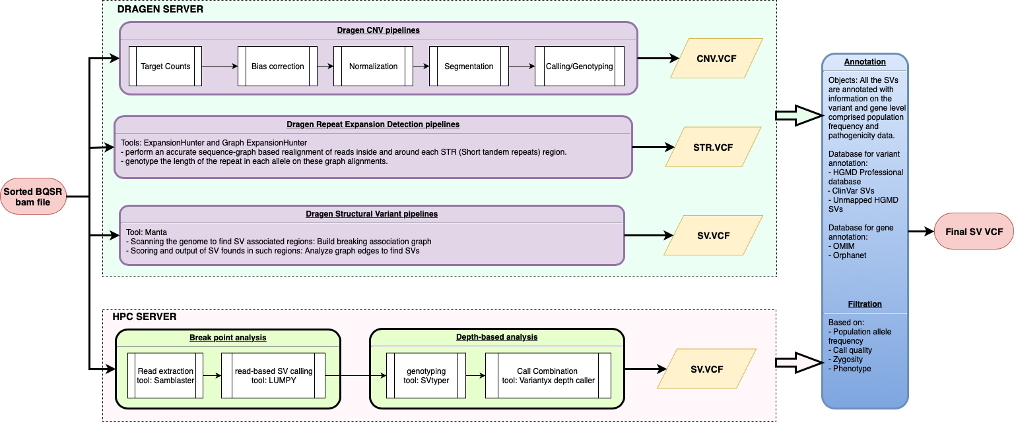
SV pipelines
